Technical Questions
Network Troubleshooting Guide
When you run into a problem that we can't reproduce on our end, our support team may ask you to capture some diagnostic files from your browser. This guide walks you through capturing the three most useful ones: the console log, a HAR file, and a NetLog.
What are these files?
The console log records messages and errors from the Prodigy application itself. A HAR file (HTTP Archive) records every request your browser made on the page and how the server responded. A NetLog records low-level connection details from the whole browser, which helps diagnose problems like blocked or dropped connections on restrictive networks. You usually only need to capture the one our support team asks for.
Check the status page first
Before capturing anything, take a quick look at status.prodigyems.com. If there is an active incident, the problem is already on our radar and you don't need to capture diagnostics — the status page will update as we work on it.
If you haven't already, it's worth running the quick checks in Try This First — many issues clear before you need to capture anything. If the trouble is on a filtered department or station network, Network Requirements for IT covers what your IT team needs to allow.
Before You Start
- Use Google Chrome or Microsoft Edge on a computer. The steps below show Chrome, but Edge works the same way.
- Grab your exact browser version: type
chrome://version(oredge://version) into the address bar and copy the first line. Include it in your email — small version differences sometimes matter. - Know how to make the problem happen. The captures only record what happens while they are running, so you will reproduce the issue while capturing.
- Note the time the problem happens and the address in the URL bar. Including these in your email helps us line your capture up with our server logs.
These files can contain sensitive information
HAR files and NetLogs can include details about your session, and console logs can include account information. Send them directly to Support@prodigyems.com — please don't post them in public places like forums or social media. When capturing a NetLog, leave the default Strip private information option selected.
Opening Developer Tools
The console log and HAR file are both captured from your browser's Developer Tools. To open them, press F12 (Windows) or Cmd+Option+I (Mac) while on the Prodigy page, or find them in the browser menu under More tools → Developer tools. A panel opens next to the page:
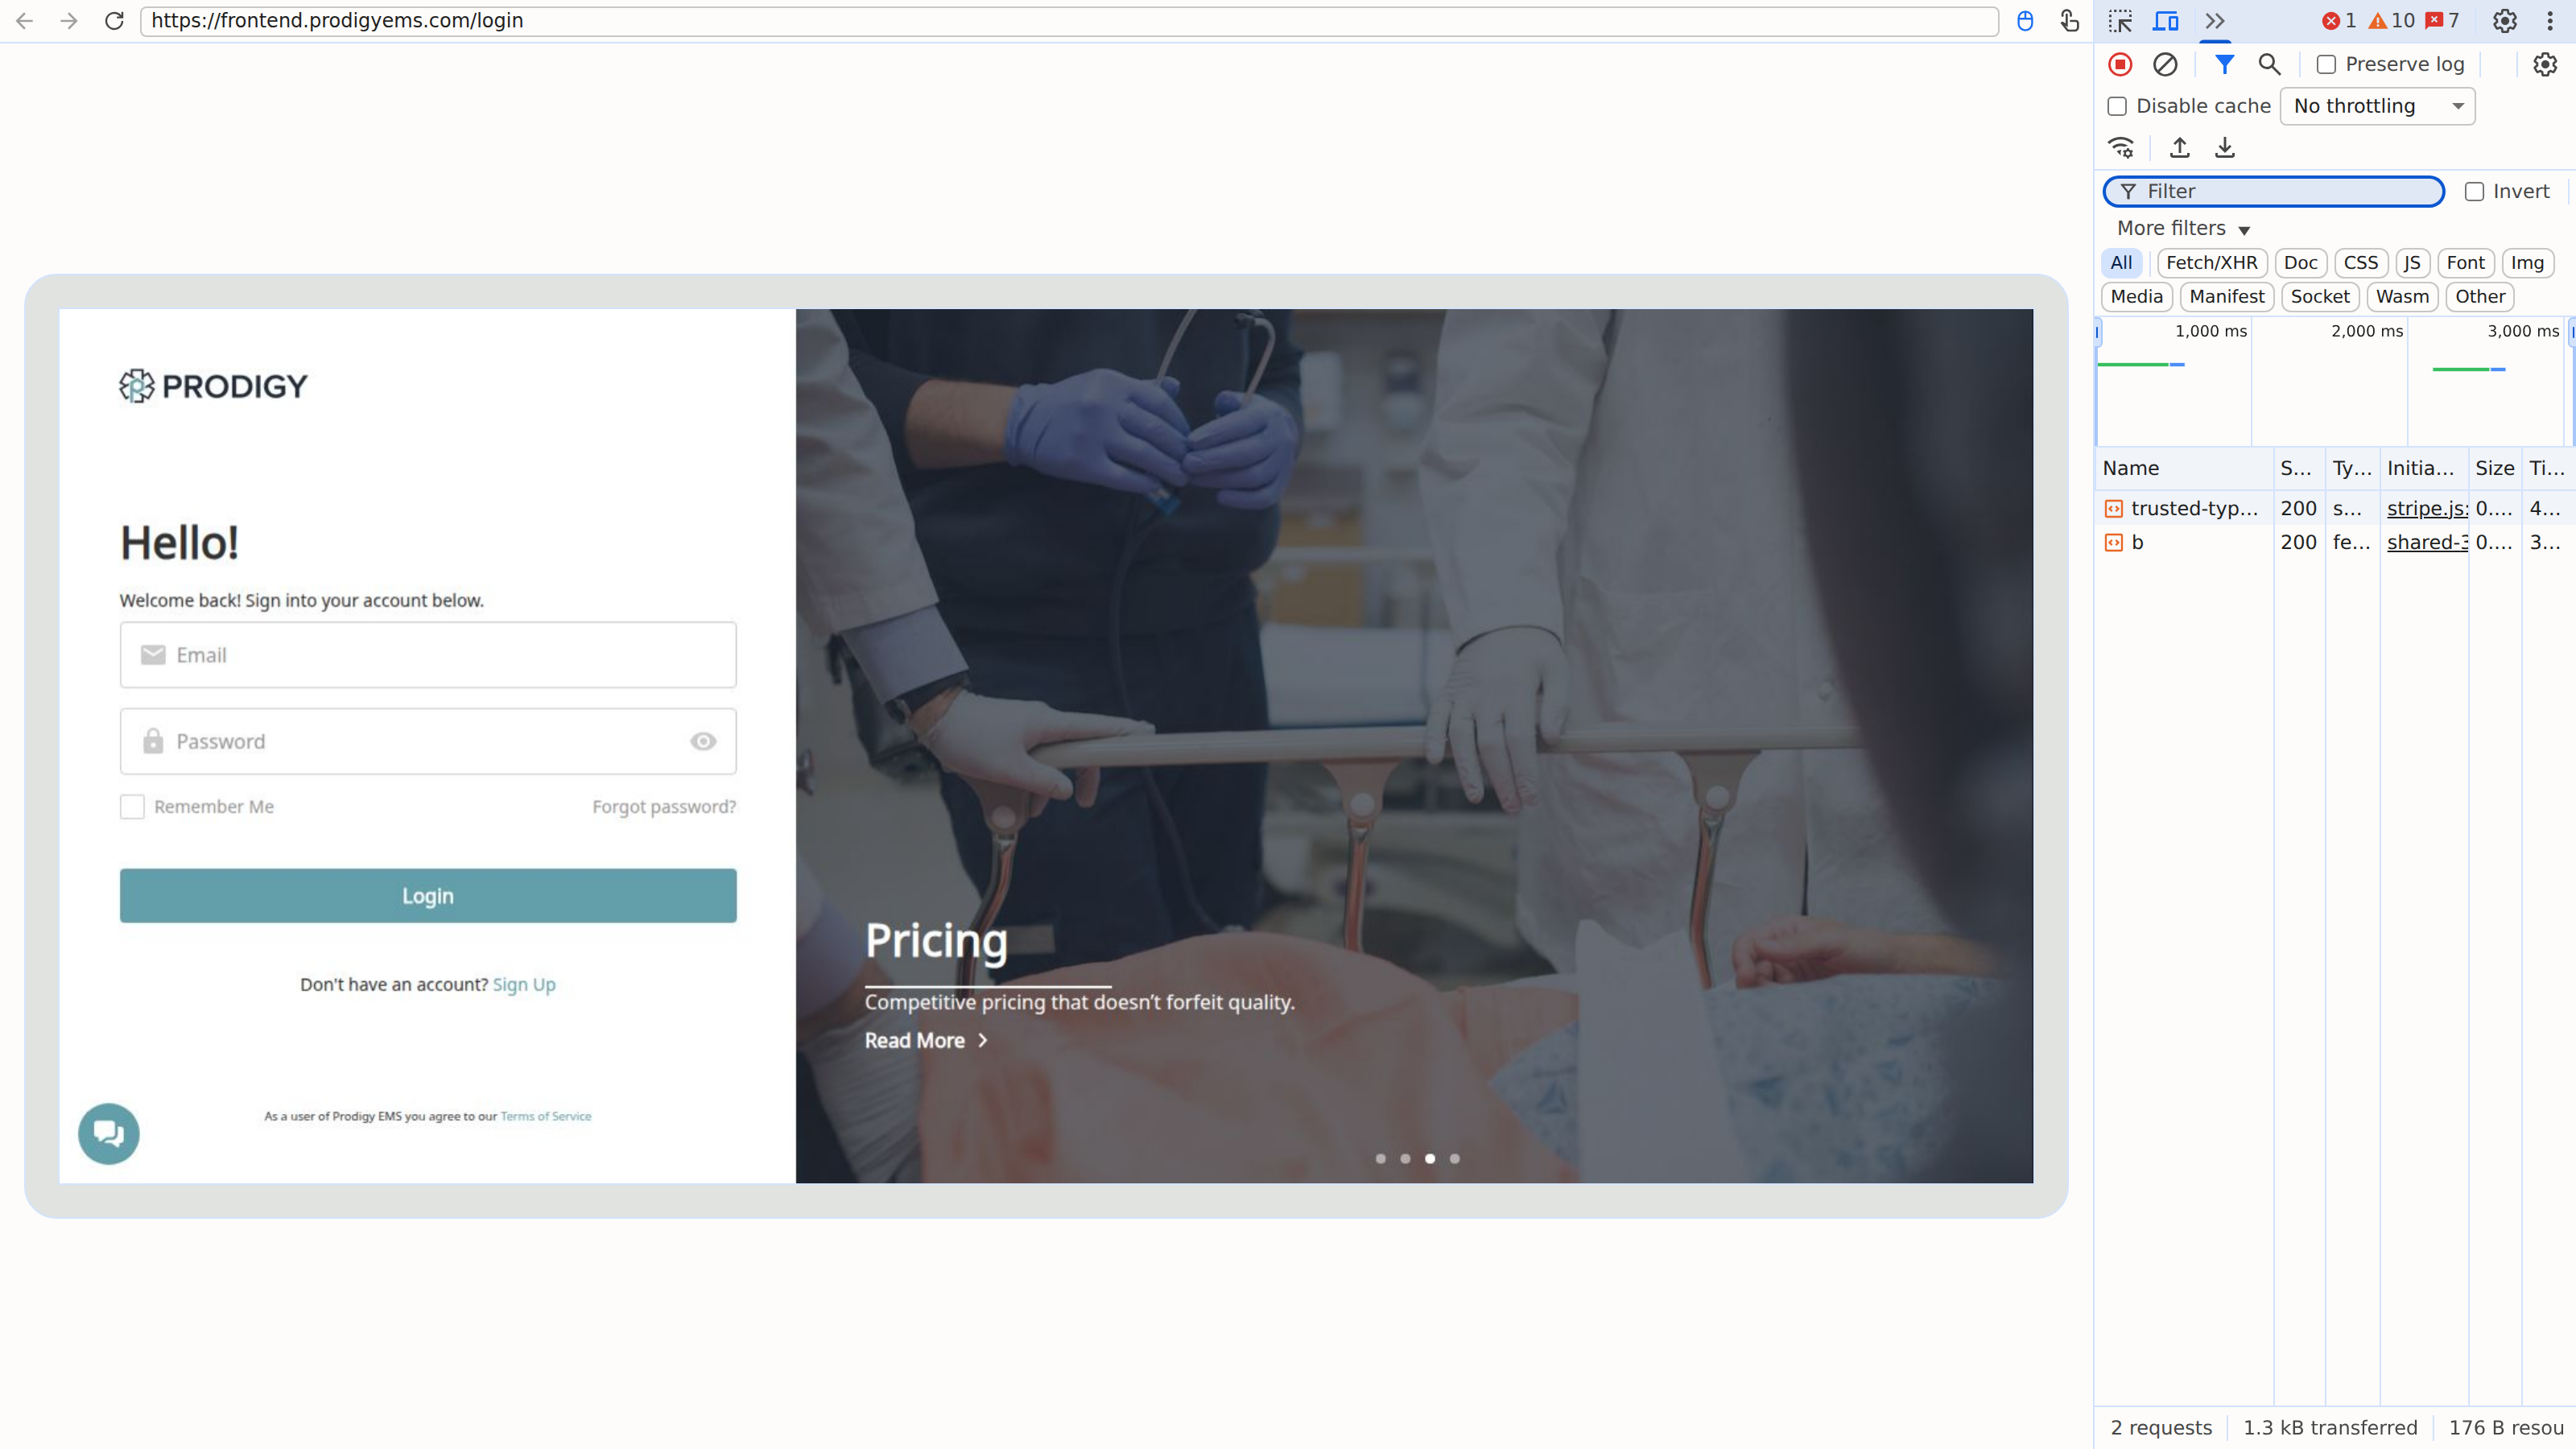
The tabs along the top of the panel — Console, Network, and so on — are where you'll work in the next two sections.
Capturing the Console Log
- Open Developer Tools and click the Console tab.
- Reproduce the problem — for example, try to log in, play the video, or open the page that fails.
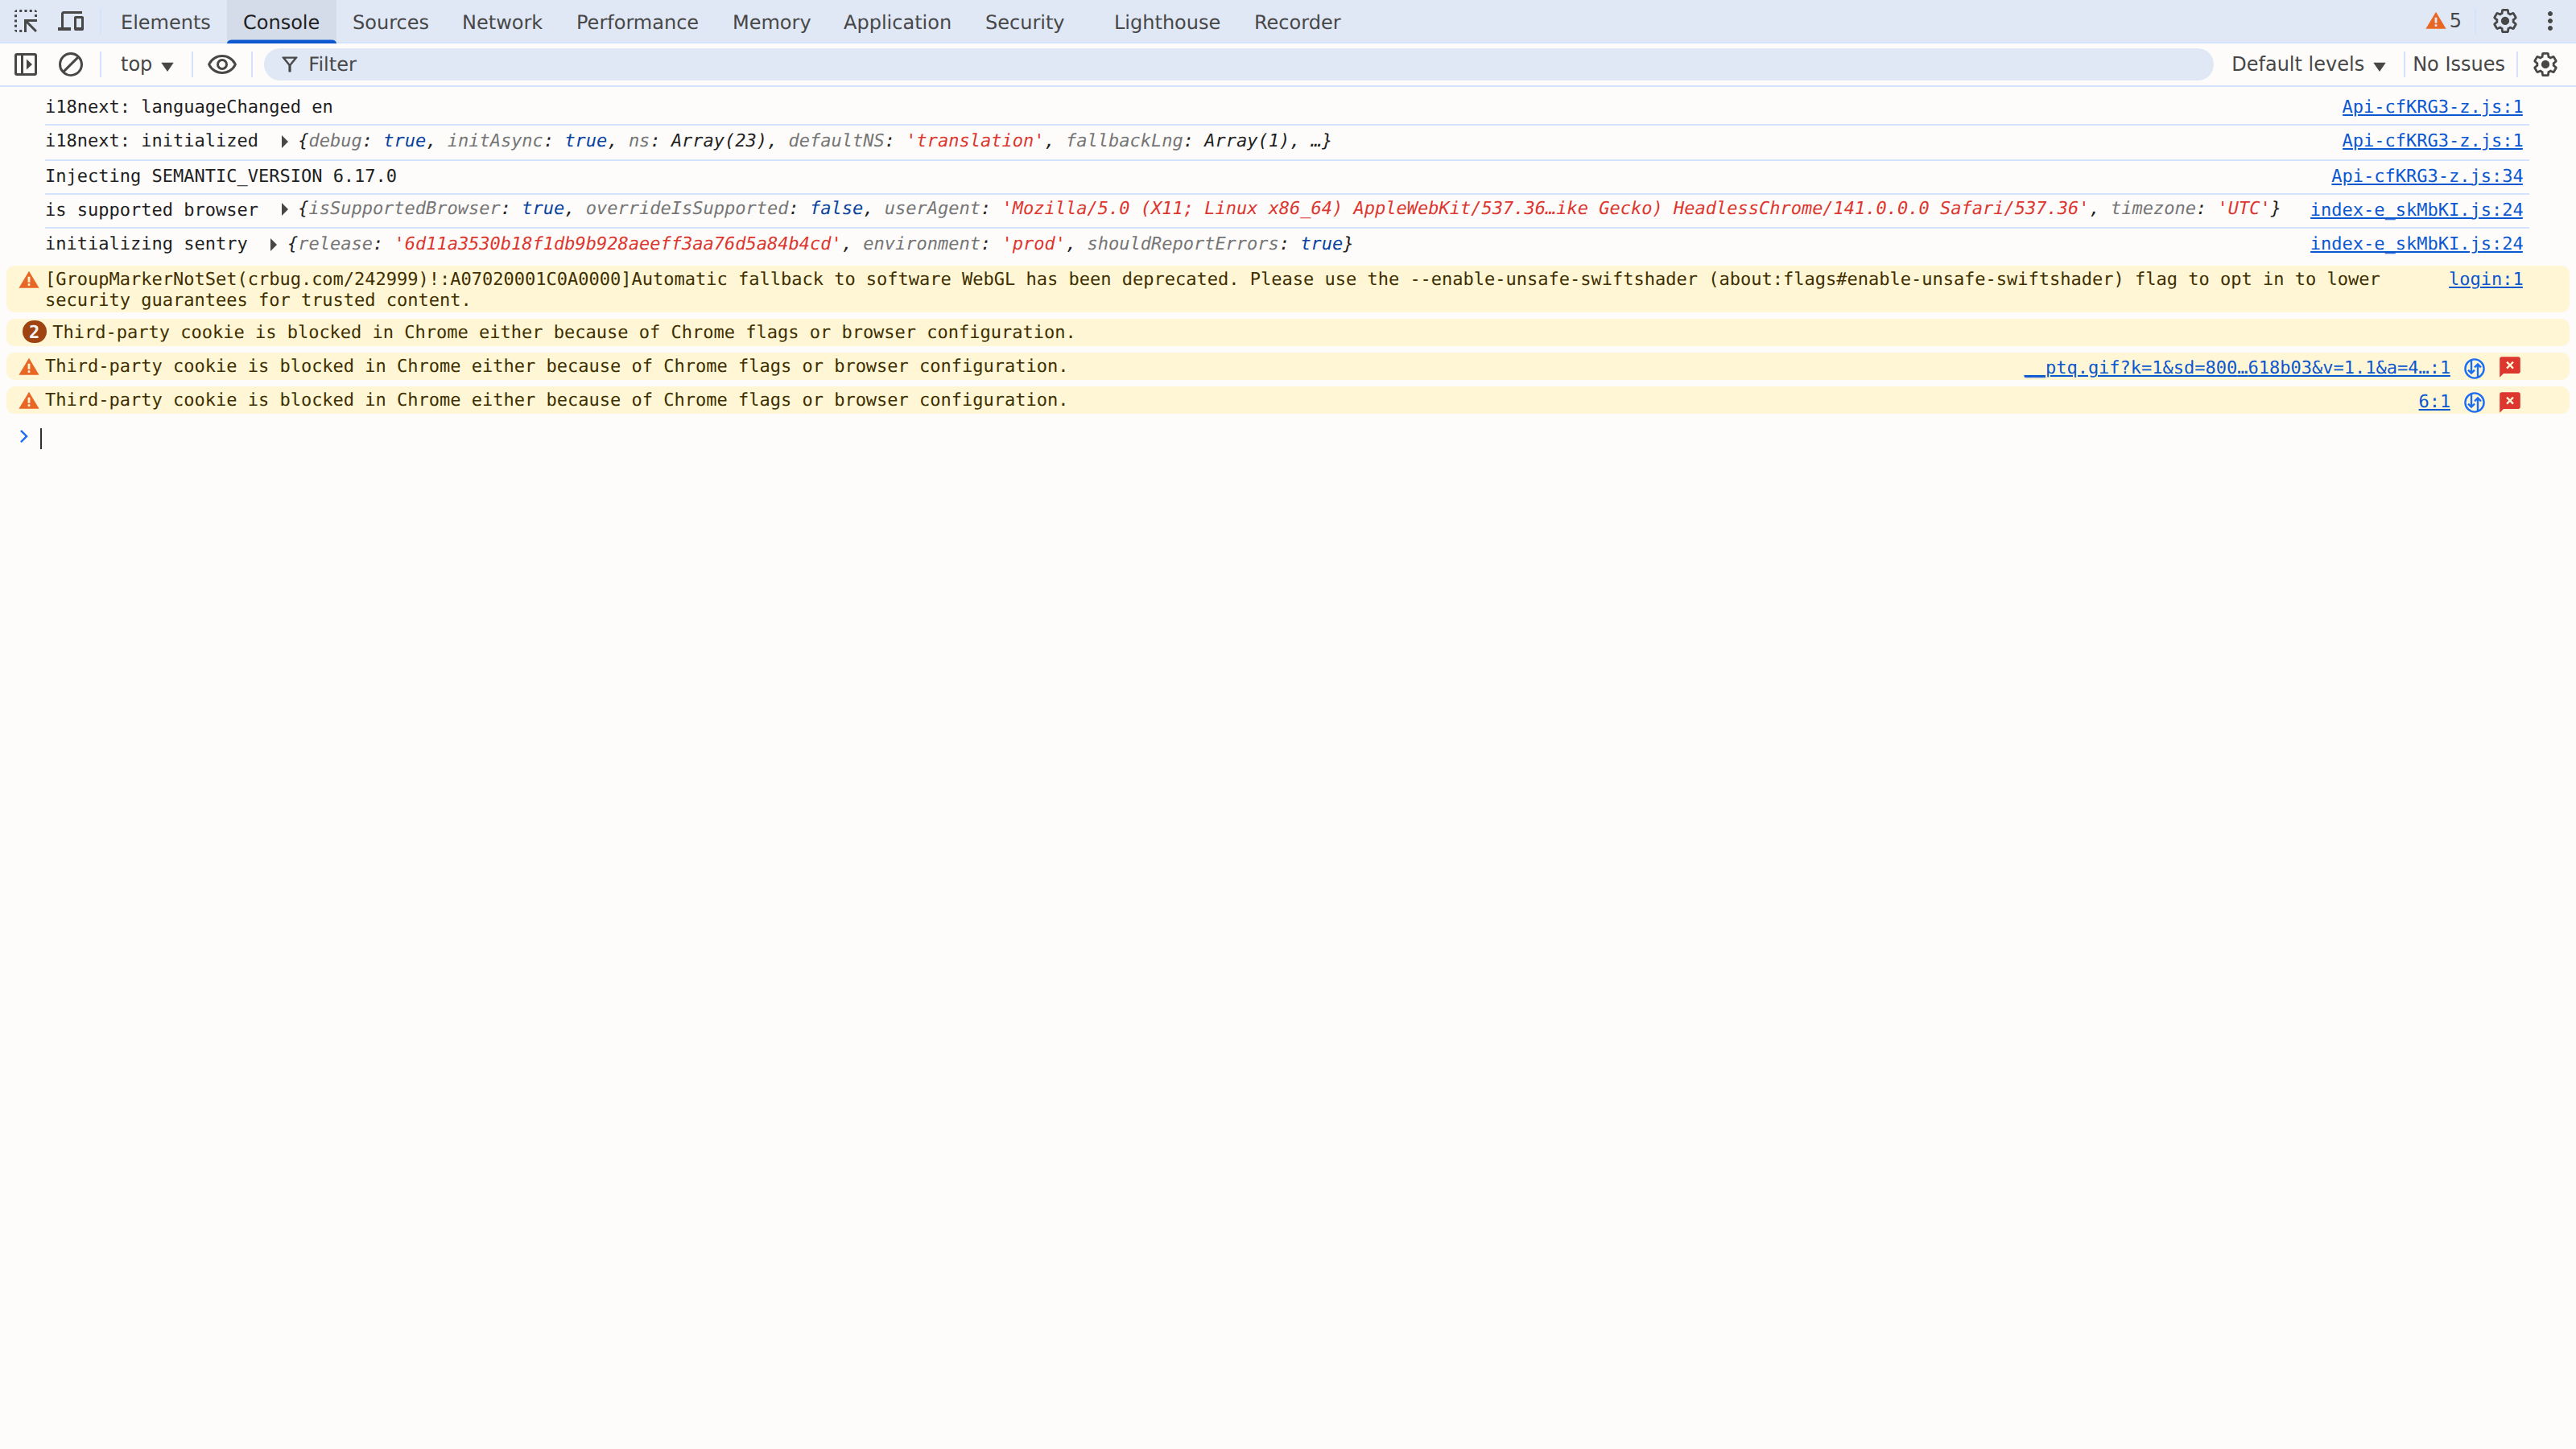
- Watch the console fill with messages. Errors appear in red and warnings in yellow:
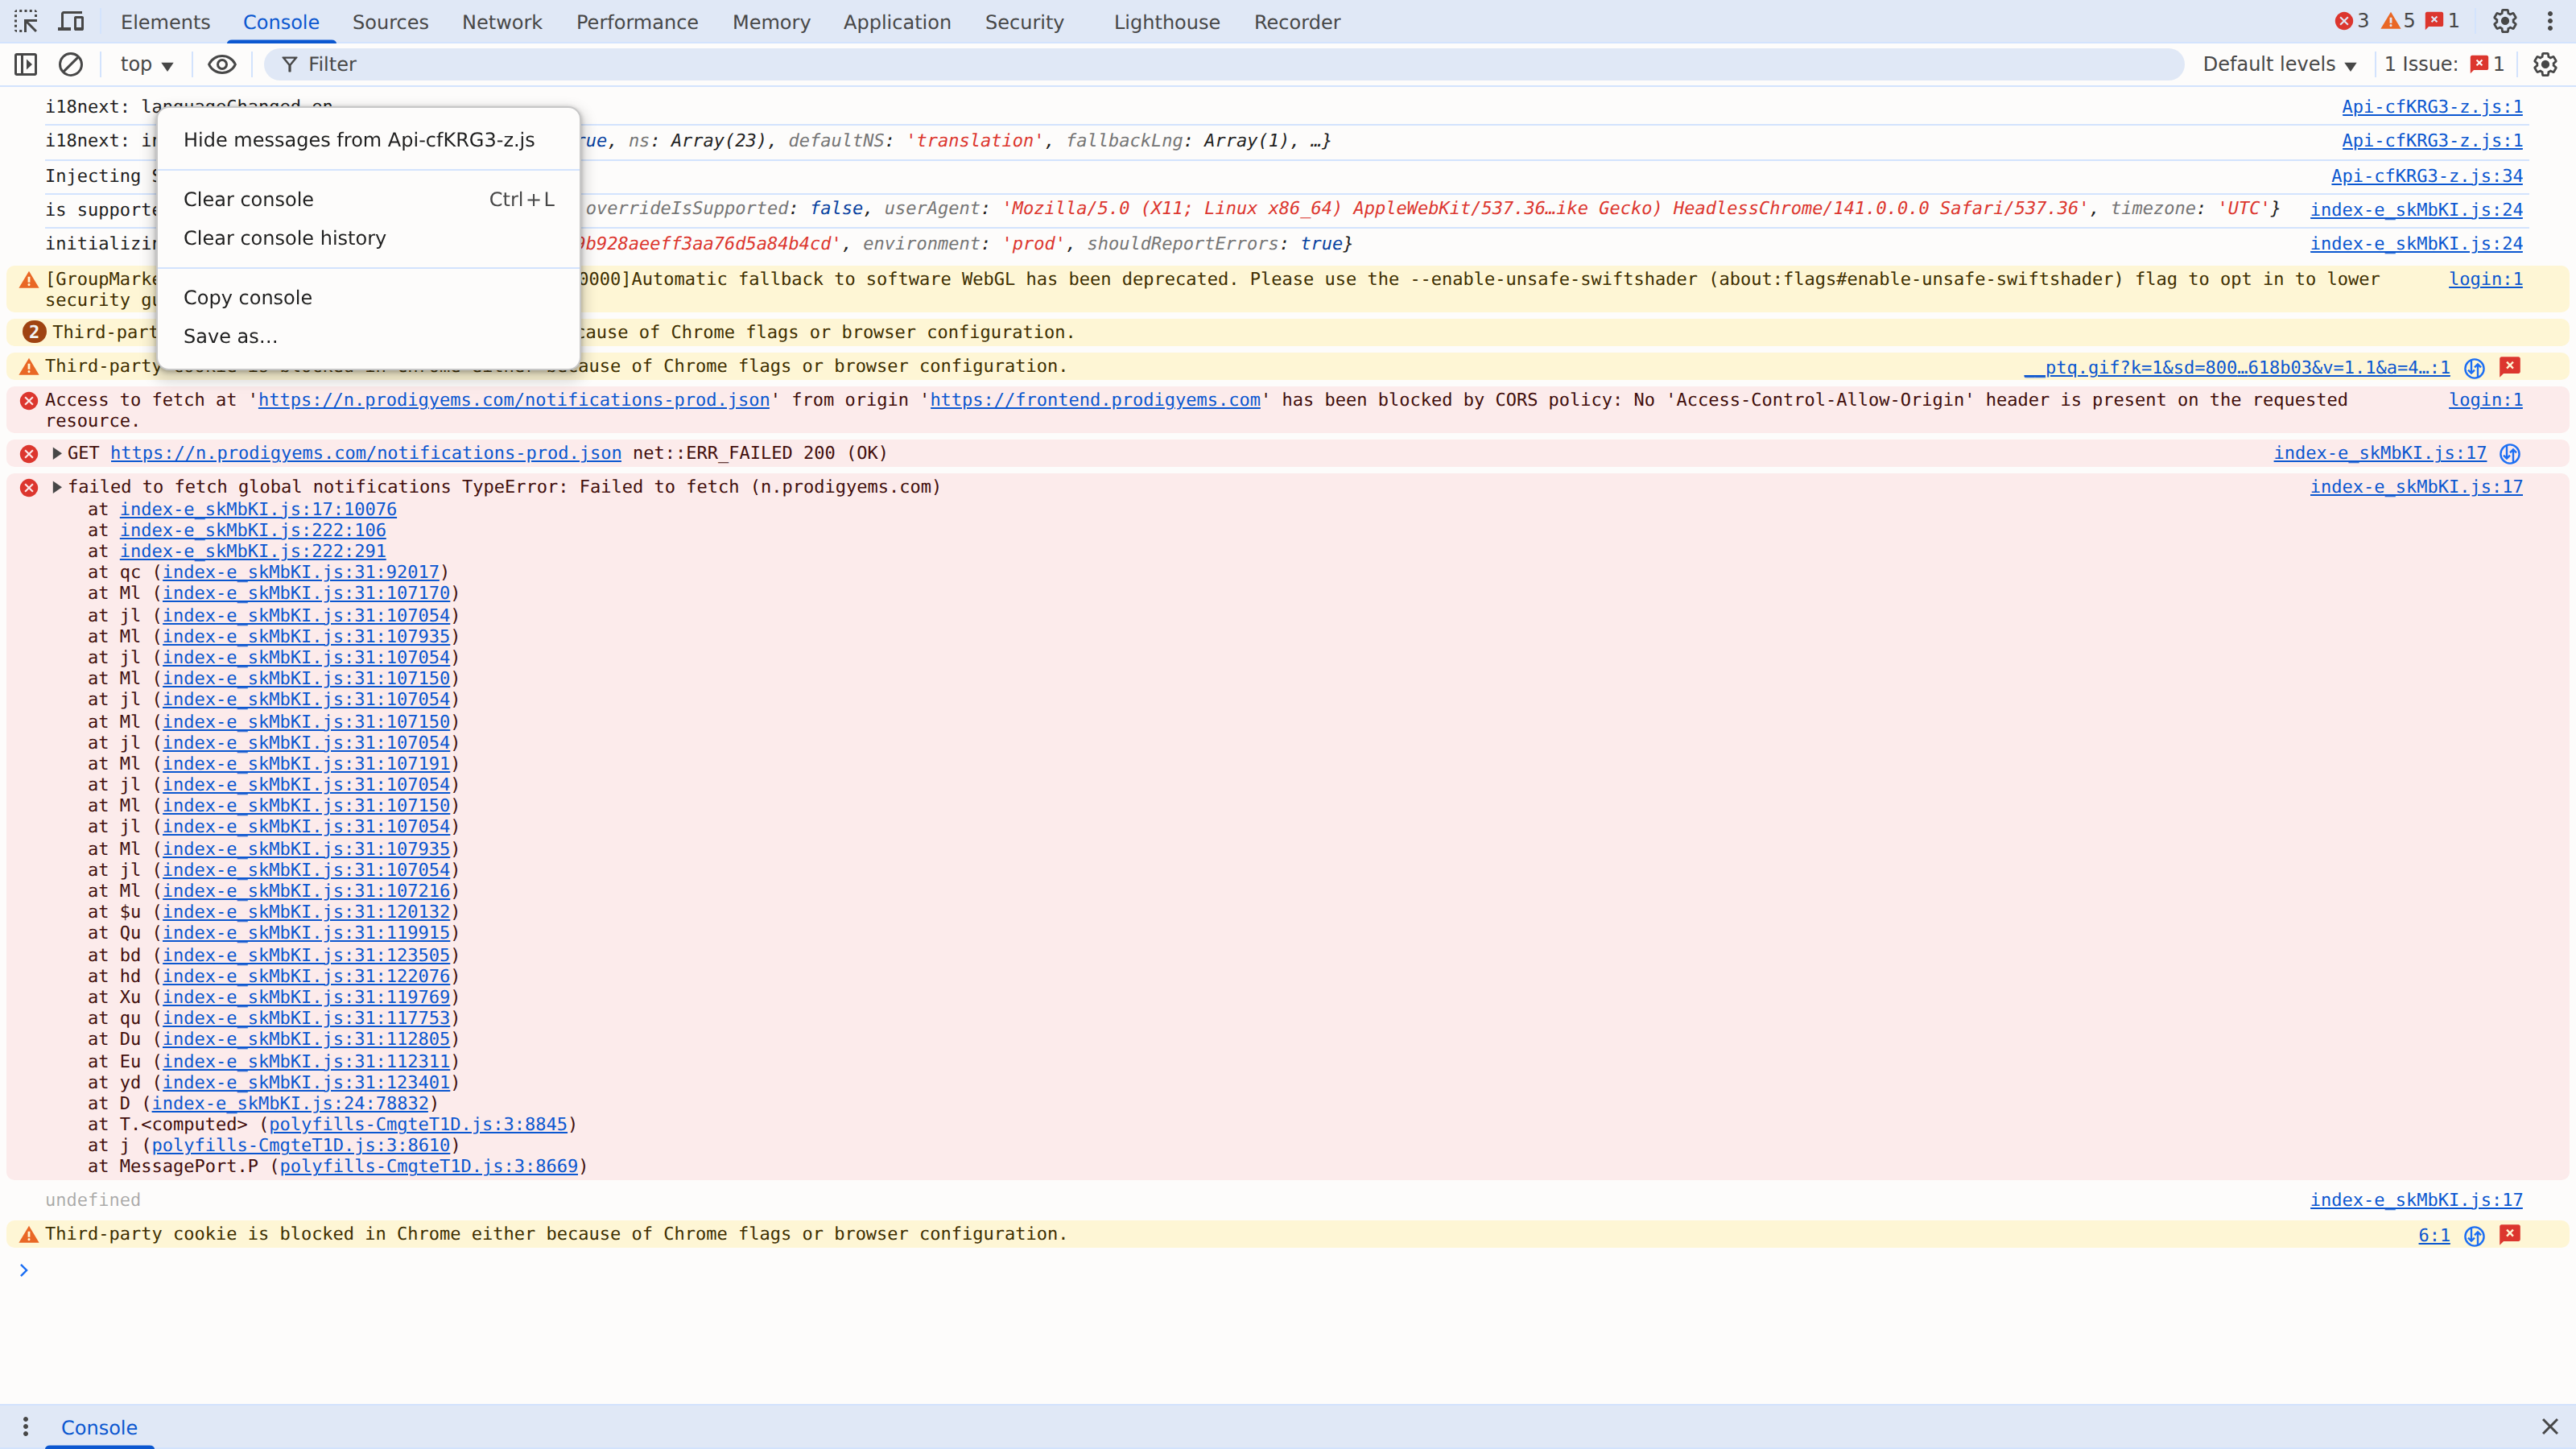
- Right-click anywhere on the messages and choose Save as... to save the whole log as a text file:
- Name the file something descriptive, like
prodigy-console-log.txt.
Capturing a HAR File
- Open Developer Tools and click the Network tab.
- Check the Preserve log box at the top of the panel, so the recording survives page reloads and redirects.
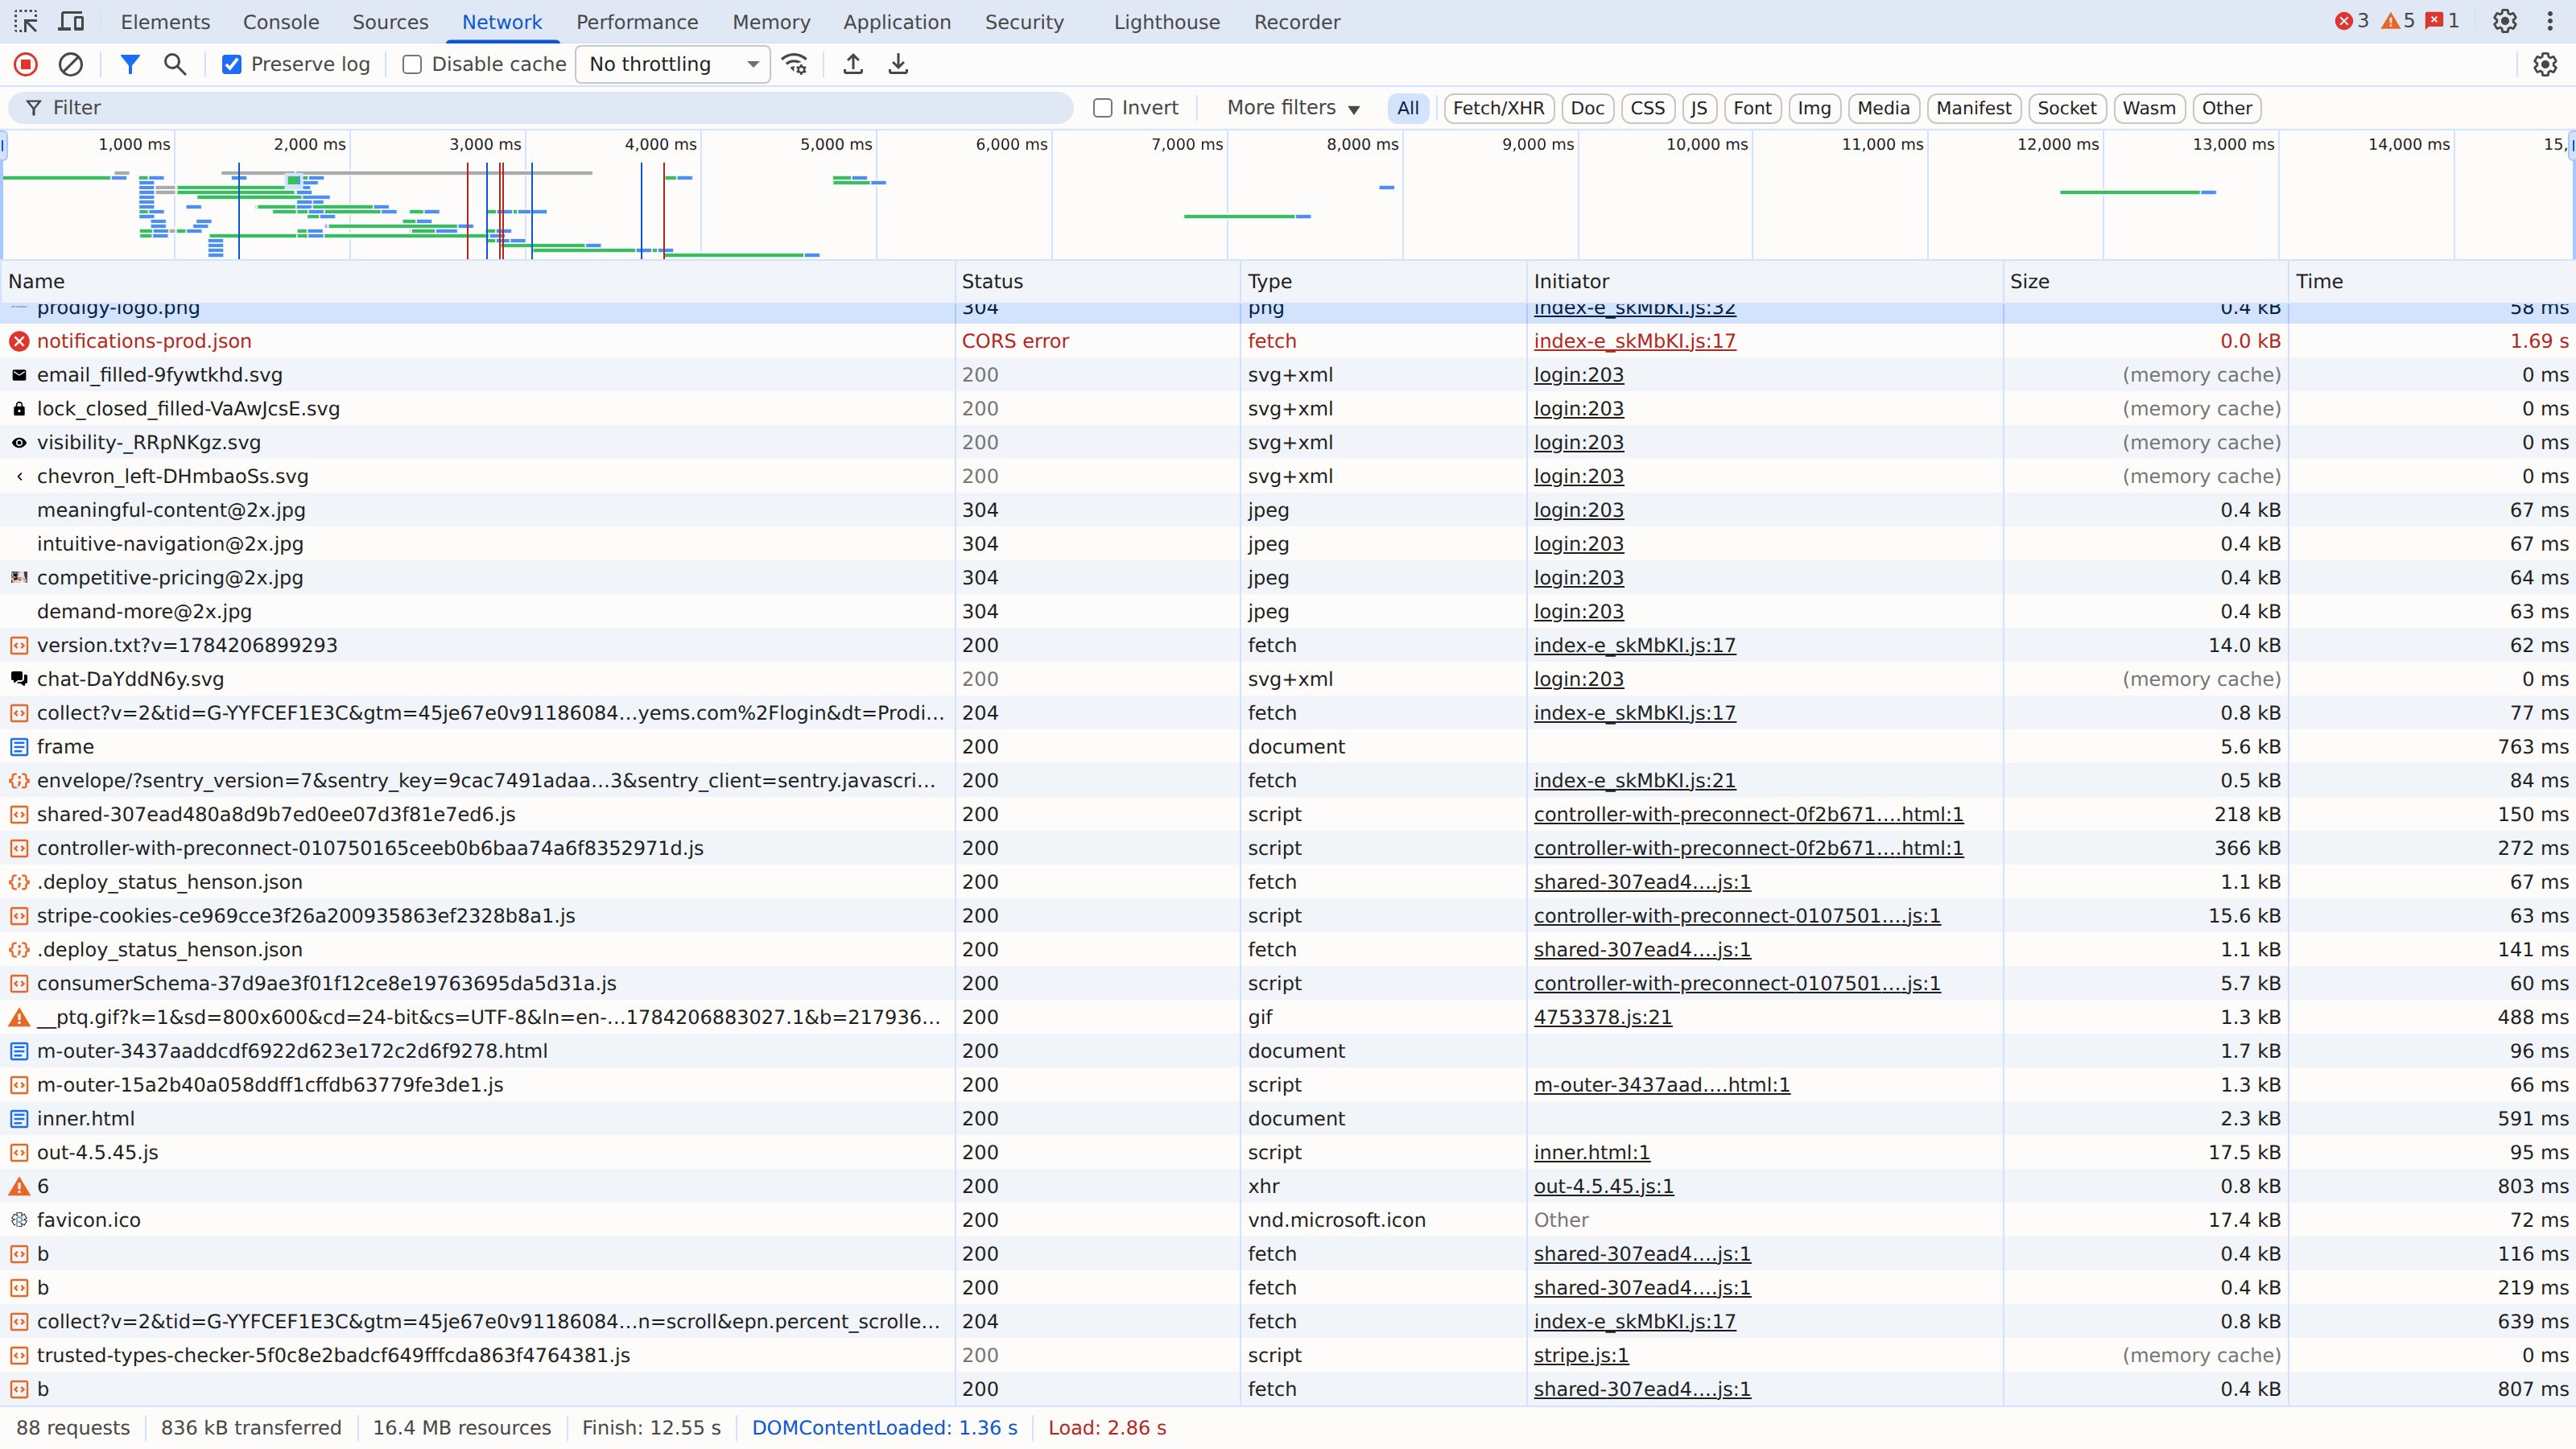
- Reproduce the problem from the very beginning — reload the page with Ctrl+R (Windows) or Cmd+R (Mac) and repeat the steps that fail. Requests fill the panel as they happen, and failed requests show in red:
- Once the problem has occurred, click the Export HAR button (the down-arrow icon, circled below) and save the file:

- Name it something descriptive, like
prodigy-issue.har.
Keep the capture focused
Only keep the Prodigy tab open while recording, and close unrelated tabs. This keeps the file small and avoids sending us information about other sites you use.
Capturing a NetLog
A NetLog captures connection-level details from the entire browser. Our team usually asks for one when Prodigy won't load at all or a video won't start, which often points to a firewall or content filter on your network (see our URL Allow List).
- Open a new tab, type
chrome://net-exportinto the address bar, and press Enter (in Edge, useedge://net-export):
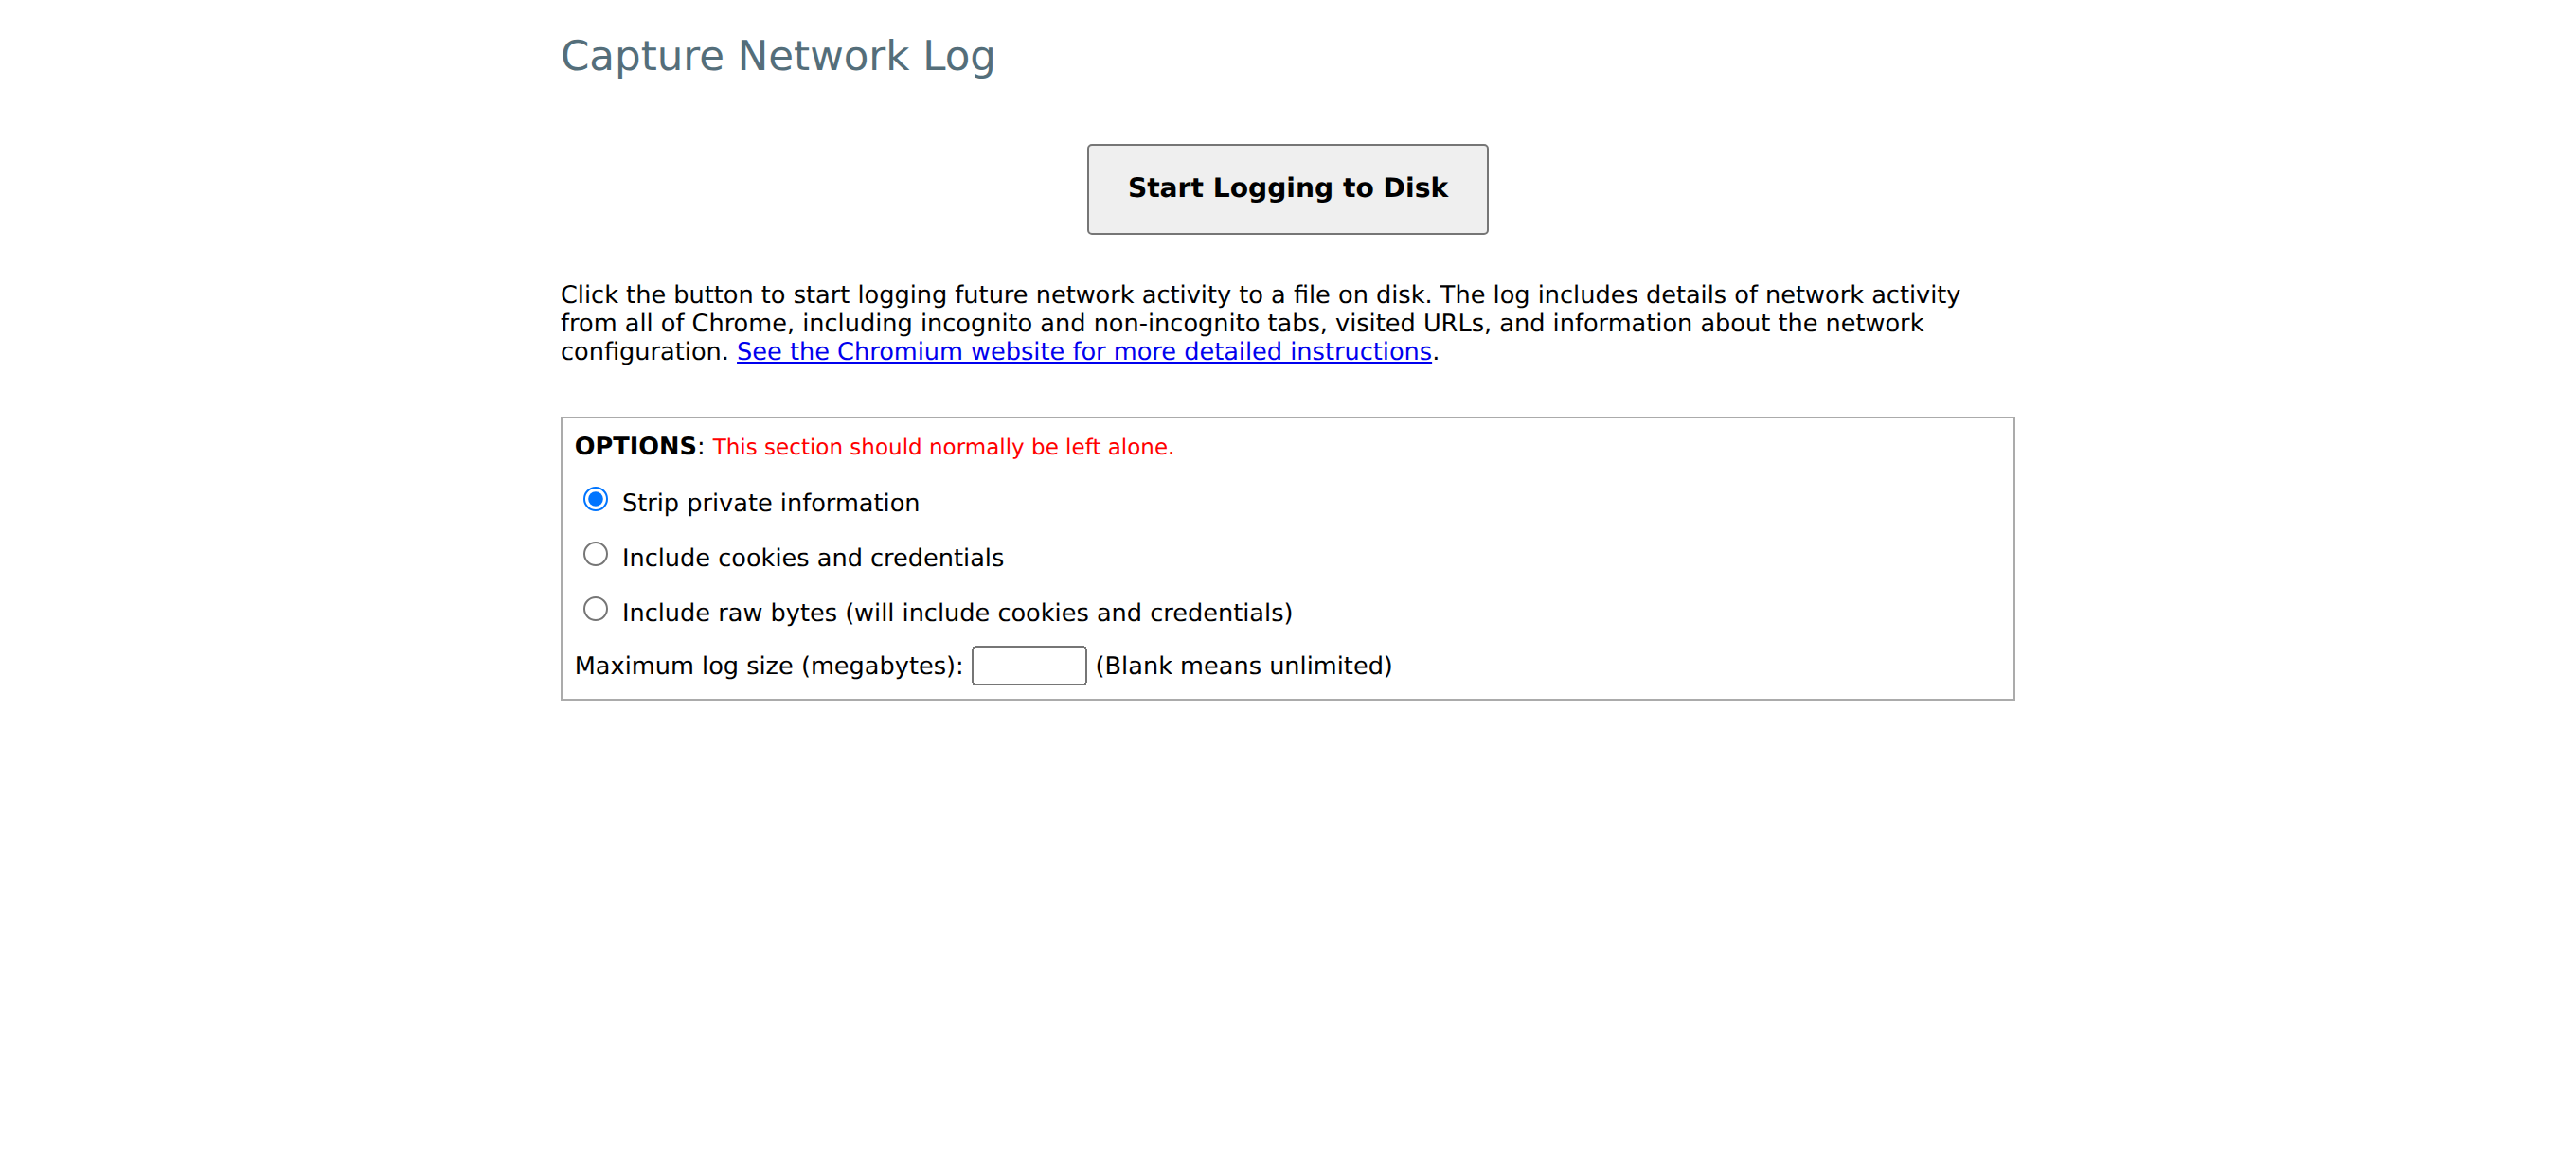
- Leave the options alone — Strip private information should stay selected.
- Click Start Logging to Disk and choose where to save the file. Chrome names it
chrome-net-export-log.json. - Switch to another tab and reproduce the problem on Prodigy.
- Come back to the
chrome://net-exporttab and click Stop Logging. The page shows the location of the finished file.
Capturing Video Playback Diagnostics
If a video loads but won't play smoothly — endless buffering, no sound, a black frame — Chrome's media diagnostics page records details that don't show up in a HAR file or NetLog, like the codec in use and playback errors.
- Open a new tab and type
chrome://media-internalsinto the address bar (in Edge,edge://media-internals):
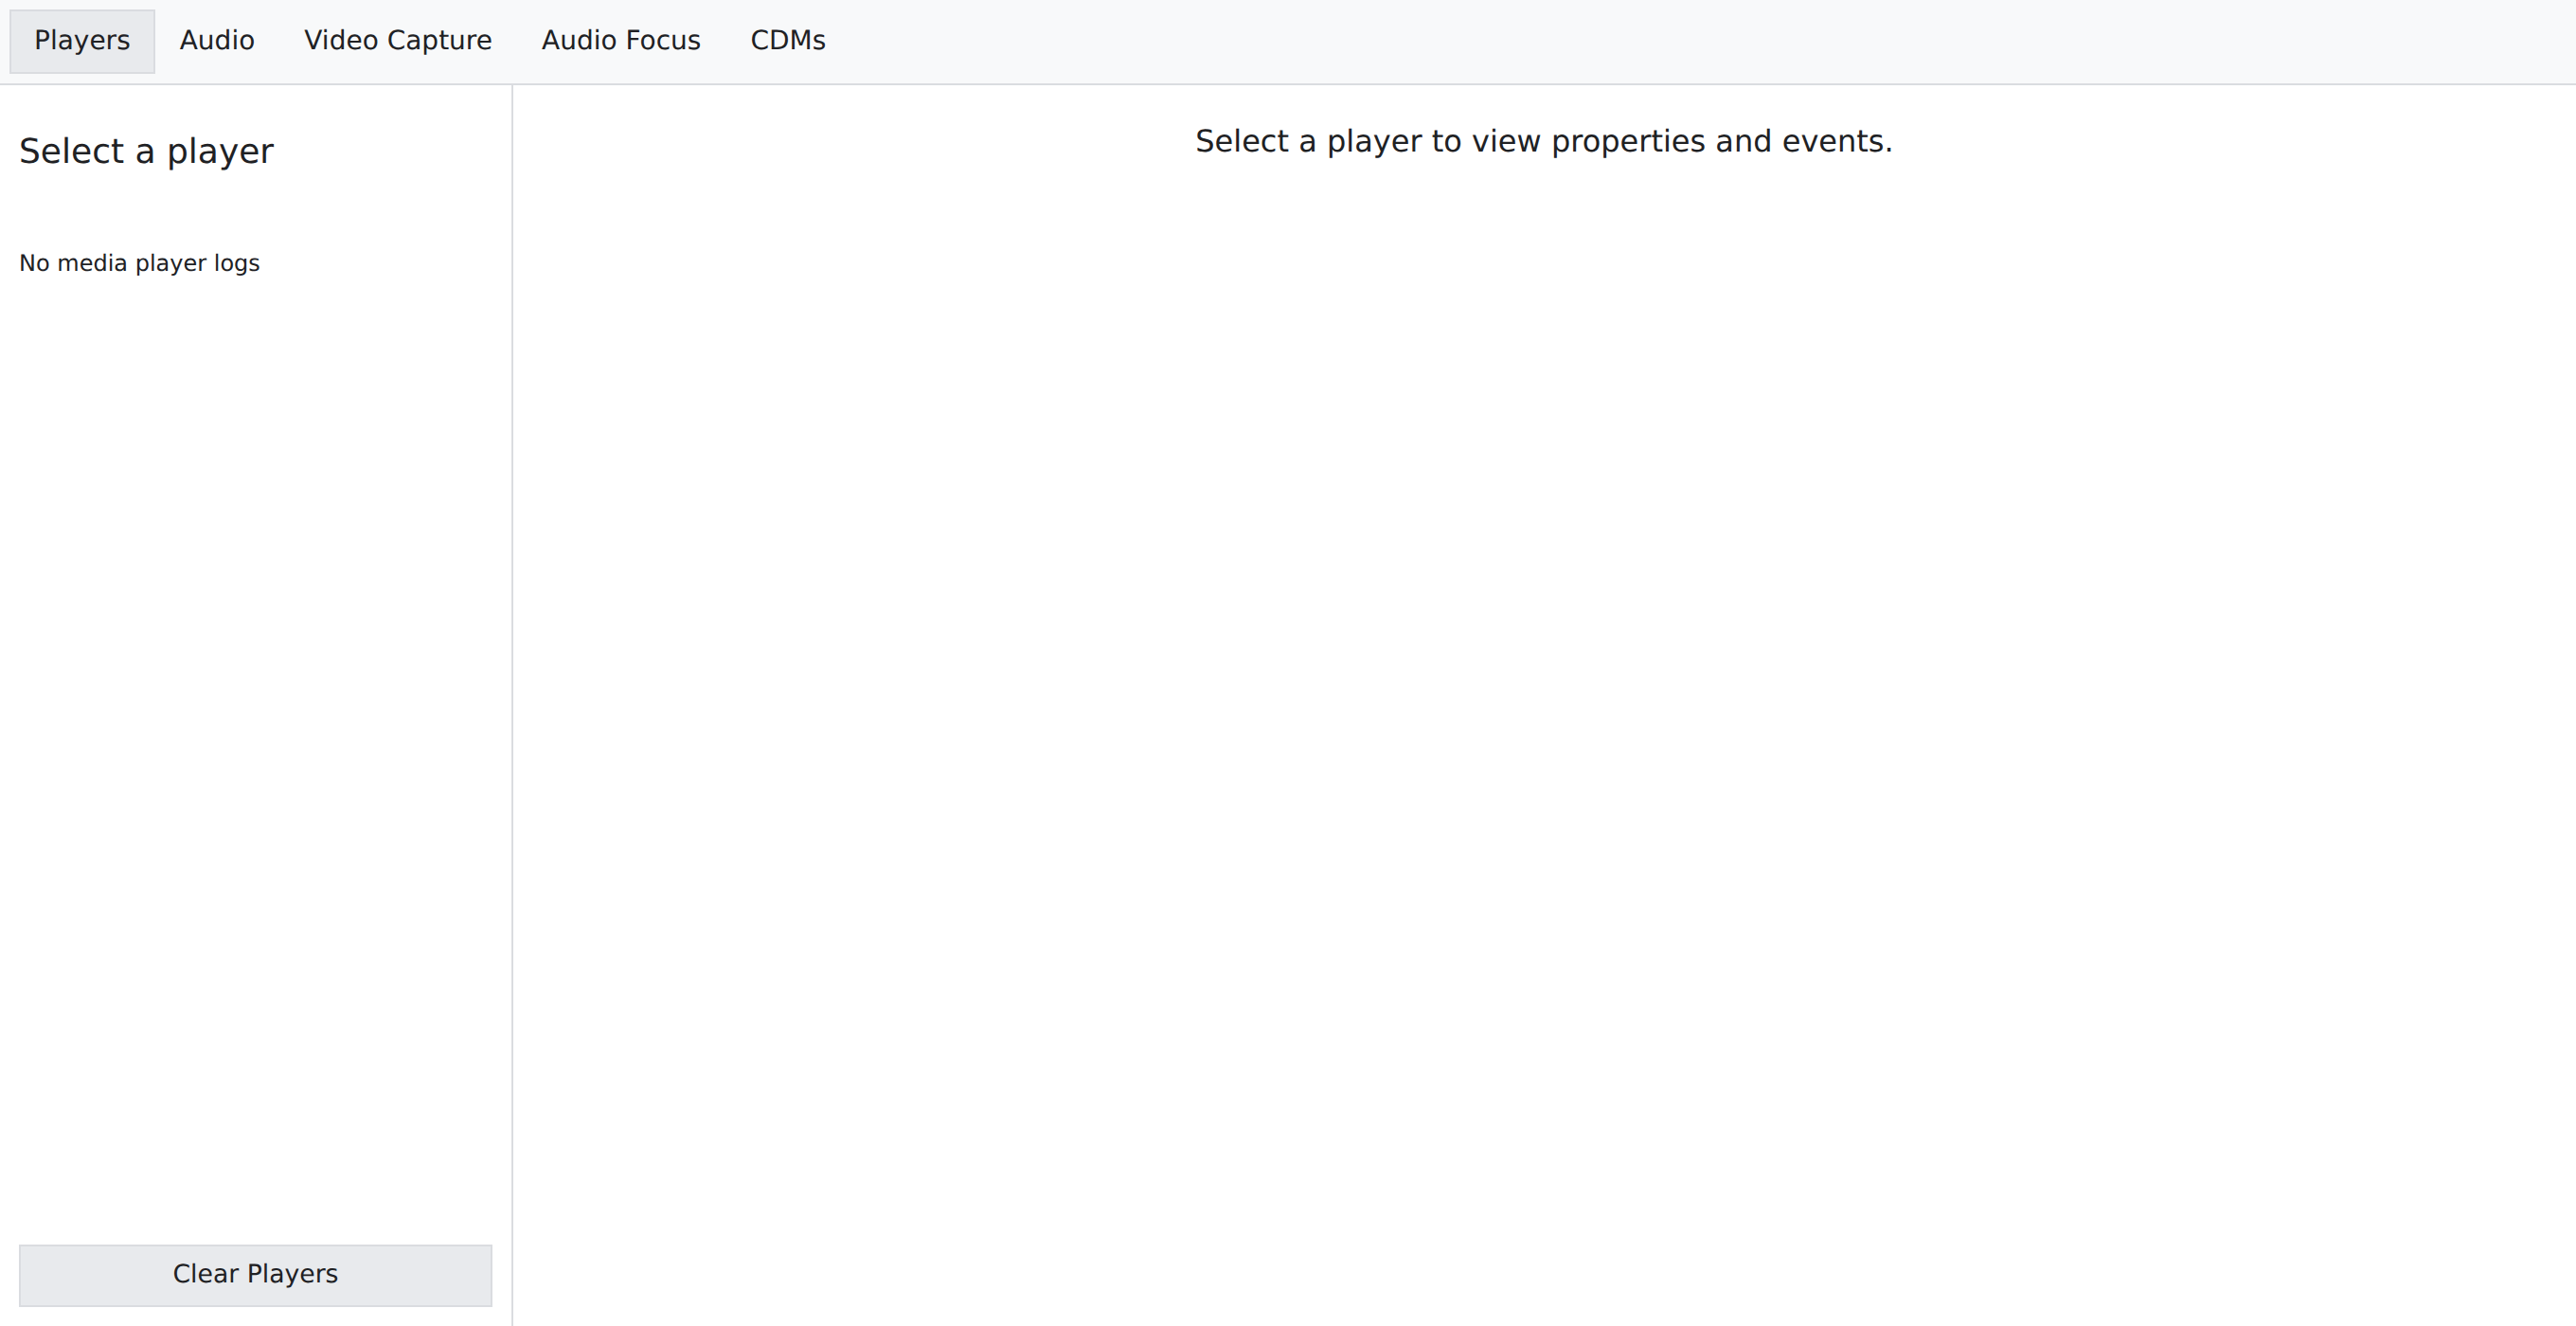
- Leave that tab open, switch back to Prodigy, and press play on the video.
- Return to the
chrome://media-internalstab. An entry now appears in the Players list — click it to expand the player's properties and event log. - There is no export button on this page, so take a screenshot of the expanded entry (or select and copy the text) and include it with your email.
Recording Your Screen
For problems you can see but logs can't easily explain — a button that does nothing, a page that renders wrong, a form that won't submit — a short screen recording is often the fastest way to show us. Both major systems have a recorder built in:
- Windows: press Win+Alt+R to start and stop recording (Xbox Game Bar). The clip saves to your Videos → Captures folder.
- Mac: press Shift+Cmd+5, choose a recording option, and click Stop in the menu bar when done.
Keep the recording under a minute if you can, and include the browser's address bar in the frame so we can see what page you're on.
Example: Reporting a Video That Won't Play
Suppose a video in one of your classes shows a spinner and never starts. Here's how you would put this guide together:
- Open the class page where the video fails.
- Open Developer Tools, go to the Network tab, and check Preserve log.
- Reload the page and click play on the video. Wait until it fails.
- Click Export HAR and save the file as
prodigy-video-issue.har. - Switch to the Console tab, right-click the messages, choose Save as..., and save
prodigy-console-log.txt. - Email both files to support:
To: Support@prodigyems.com
Subject: Video won't play in "Airway Management" class

Hi Prodigy Support,

The video in the "Airway Management" class won't play — it spins
and never starts. This happens every time on our station network,
but works fine from home.

Happened at: July 16 around 2:15 PM Eastern
Page: the class player page for "Airway Management"
Browser: Chrome on Windows 11

Attached: prodigy-video-issue.har, prodigy-console-log.txt

Thanks,
Jordan
Sending the Files to Us
Email the files as attachments to Support@prodigyems.com, along with what went wrong, the time it happened, and the page you were on. If a file is too large to attach (NetLogs can grow quickly), compress it into a .zip first, or reply to your support ticket and we'll send you an upload link. You can also start from the chat icon on the Prodigy page and our team will tell you where to send the files.